.... 7 minutes read .. 7 minutos de lectura ....
How to Engage Your Audience with Graphs and Diagrams
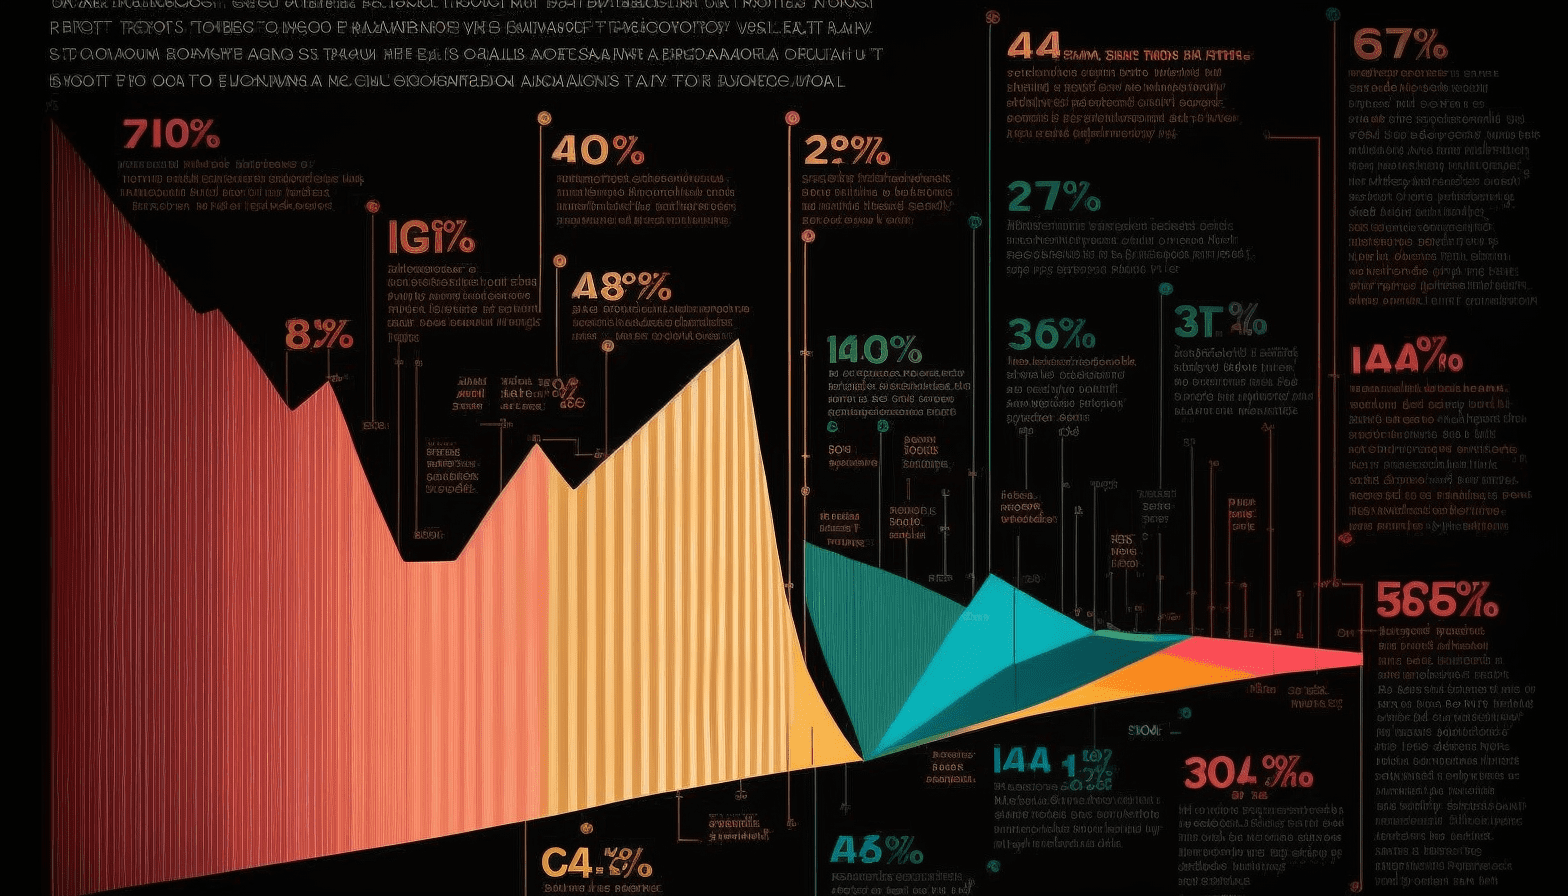
Visualization is the practice of creating visual representations of data or information in order to illustrate and highlight important facts and ideas. For example, presenting a graph instead of rows upon rows of data points is an effective way to convey complex information quickly and easily. When done right, visualization can truly engage your audience with vivid images that bring concepts to life.
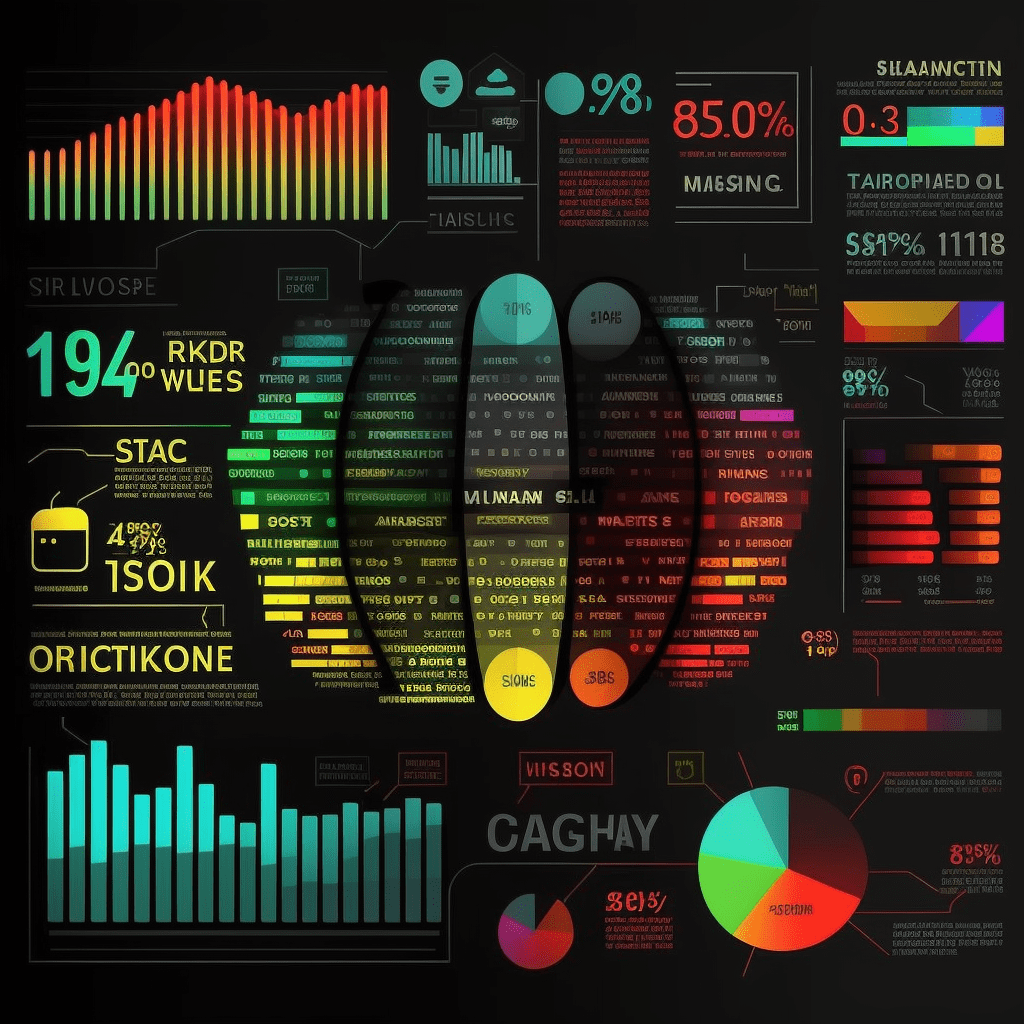
Different visualizations help make complex information easier to understand. Graphs, diagrams, and charts are all types of visualizations. They show relationships between concepts in a way that is easy to see and understand. For example, a graph can illustrate how two variables affect each other in a linear fashion, while a chart may be used to compare and contrast different sets of data points.
When looking for examples of effective visuals that have been used successfully, look no further than the news. Journalists use visualizations to present complex topics in an engaging way by including photographs and infographics alongside articles. In addition to being aesthetically pleasing, these visuals help viewers quickly understand key points and draw conclusions from facts they are presented with.
What is the audience thinking?
- Easier to understand complex data and information
- Enhances engagement with the topic
- Helps draw meaningful conclusions from facts
- Quicker understanding of key points
- Improved recall of data or information presented
- More visually appealing than plain text or numbers
In addition, using visuals when presenting data or information is powerful because it can make any topic more interesting. Visuals help tell stories, add context, and even spark debates among your audience members. Additionally, by using visuals you can help people retain information more easily, as it is proven that our brains are better equipped to process visual content than text.
Creating Visuals
When creating visuals for presentations or other communications, there are a few things you should keep in mind. Firstly, choose visuals that are easy to understand and accurately represent the data you’re presenting. Secondly, make sure your visuals have high-quality graphics and colours that won’t distract from the story they’re telling. Lastly, include captions or labels wherever necessary so that your audience can fully understand the meaning of each visualization.
Filling presentations with lots of text can be overwhelming for the audience and make it difficult to process the information. Visuals, on the other hand, create a chance to break up the monotony of reading and engage your audience with interesting graphics that help them better understand complex concepts. By carefully selecting visuals that have been tailored to suit your topic, you can ensure that your presentation will be both informative and eye-catching.
What to look out for
- be keeping it simple and not trying to overwhelm
- concentrate the message on the important information and reduce noise
- show understanding of the topic
- avoid creating a document to read
If there is a desire to ensure there is a record of all the information that went into the message consider having an appendix or add hidden slides that do not appear when you are presenting. This will allow the audience to take away what they need and also have access to all the data if needed.
....Our course listing ..Nuestra lista de cursos ....
Our next scheduled public training
If you don't see a slot that you like please get in touch and we can create one for you.
Boost your team with engaging, informative and expert training


